I have recently started using Doxygen in anger and have been quite impressed with it. In addition to the documentation of code that you would expect, one of the most powerful and coolest features is the ability to create various types of diagrams showing various aspects of the application such as collaboration diagrams object and call graphs, etc.
The easiest way to configure your application is to use Doxywizard . On Linux, if you do want the object and call graphs then you would need to choose to enable the DOT option. If you do that you will need to have Message Sequence Charts installed (typically found in /usr/bin/mscgen) and also Graphviz. DOT can typically be found in /usr/bin/dot.
If you are on Windows and use Visual Studio, then there are a few add-ins which will work - with VS.NET 2005, 2008 and 2010 ; more details here .
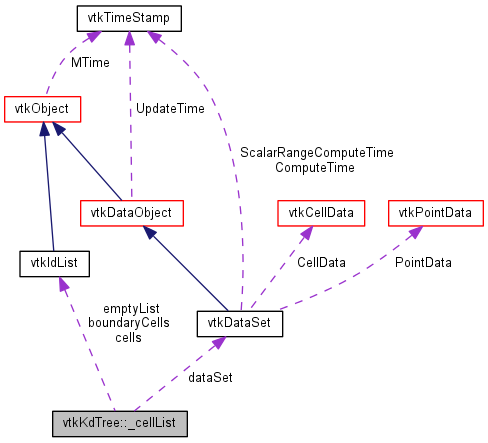
Below is a simple example of a collaboration diagram taken from VTK project . You can find more samples . When you do browse the code, click on the Classes link - that is where you can see the various diagrams.